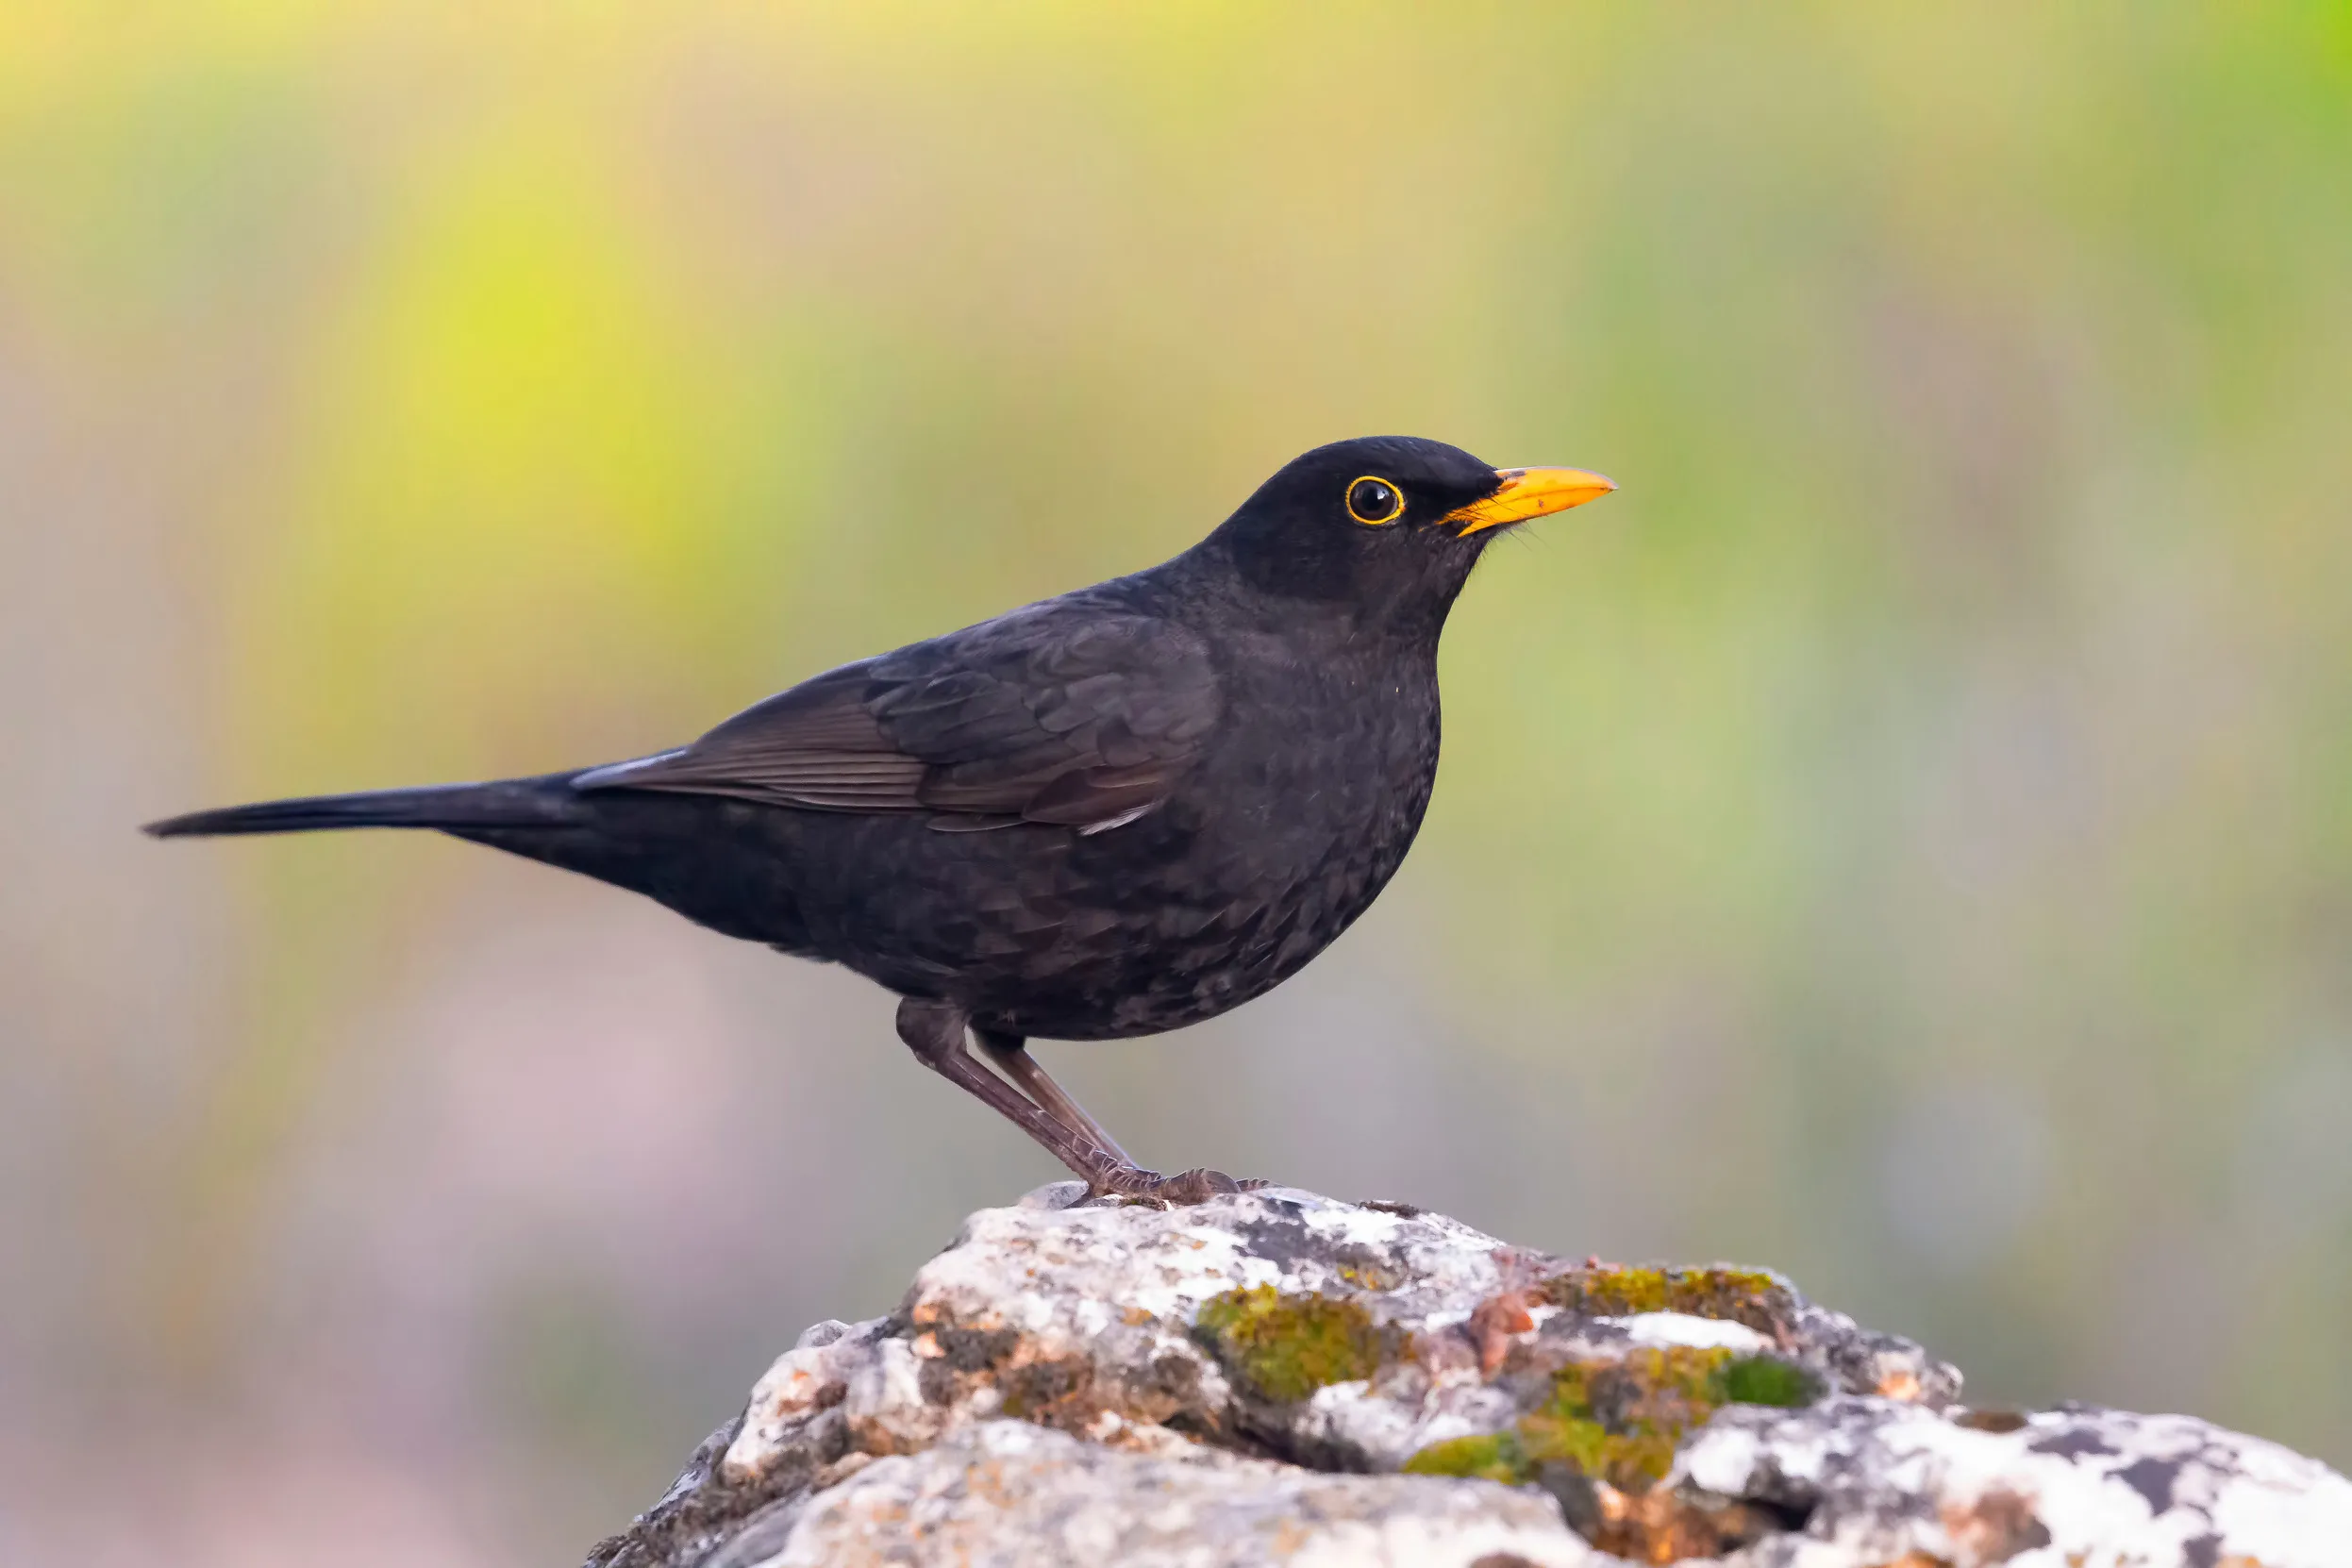
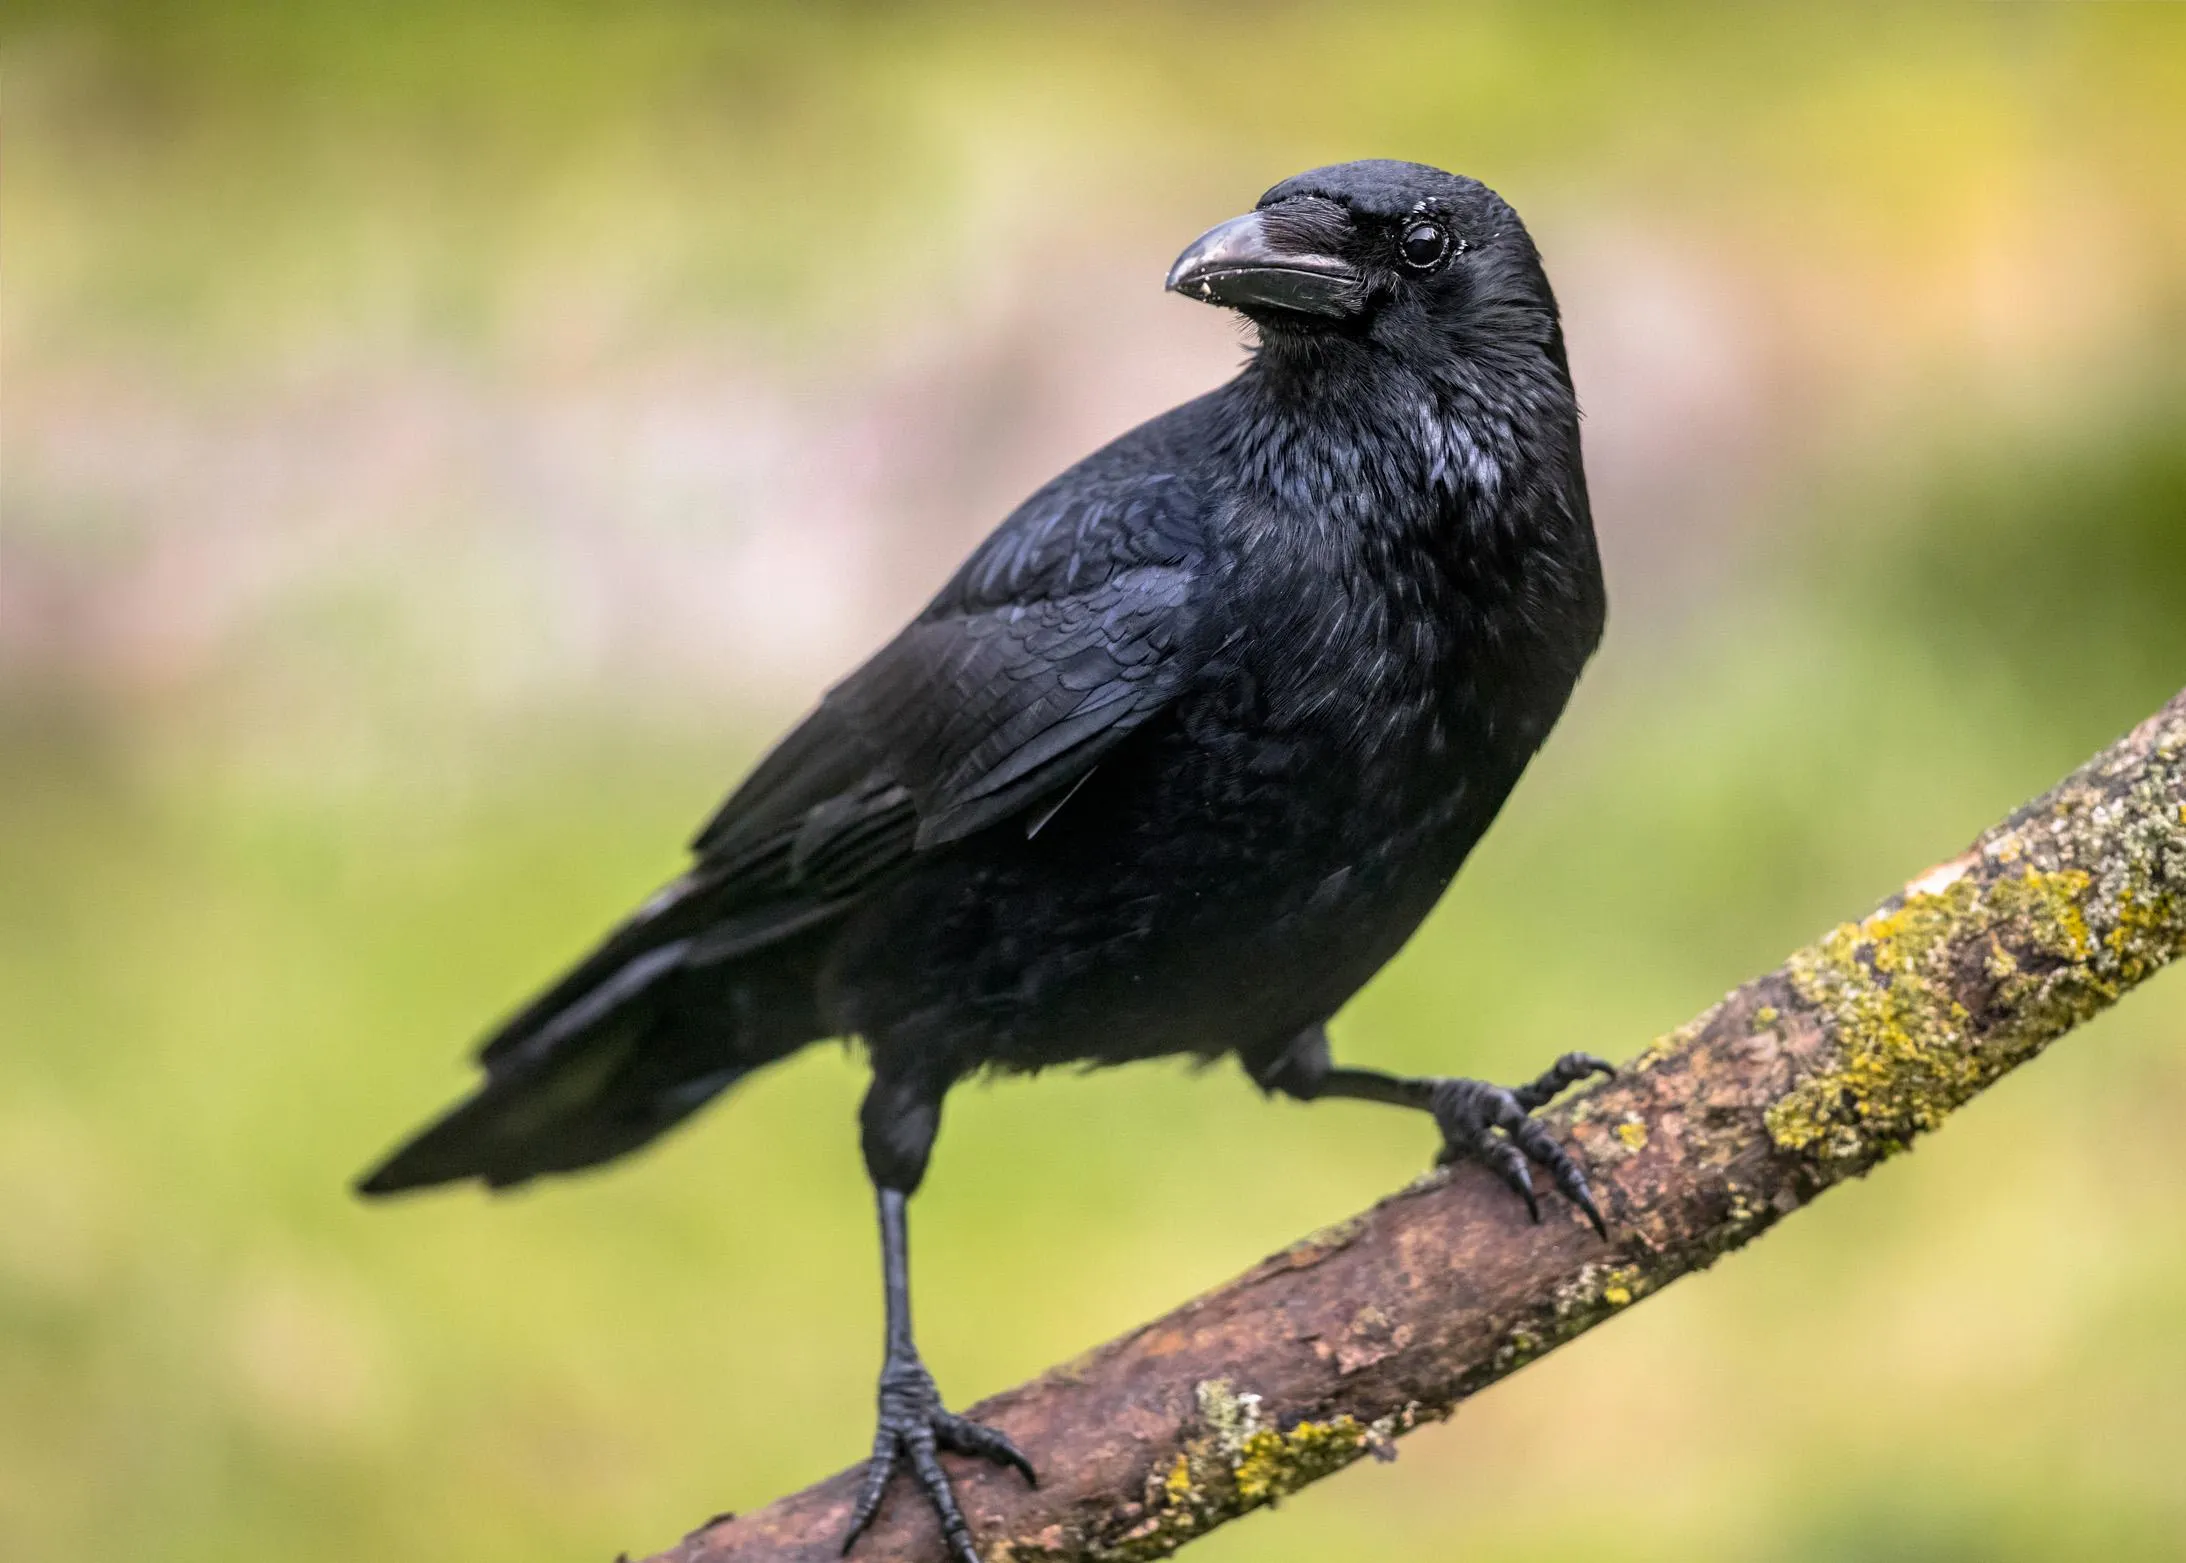
Blackbird
Blackbirds are common garden birds. Listen out for the male Blackbird singing, often from the top of a tree or chimney pot.
A huge thank you to everyone who took part in the RSPB's Big Schools' Birdwatch. The results are now in, so it's time to see how your school compared with the rest of the UK.
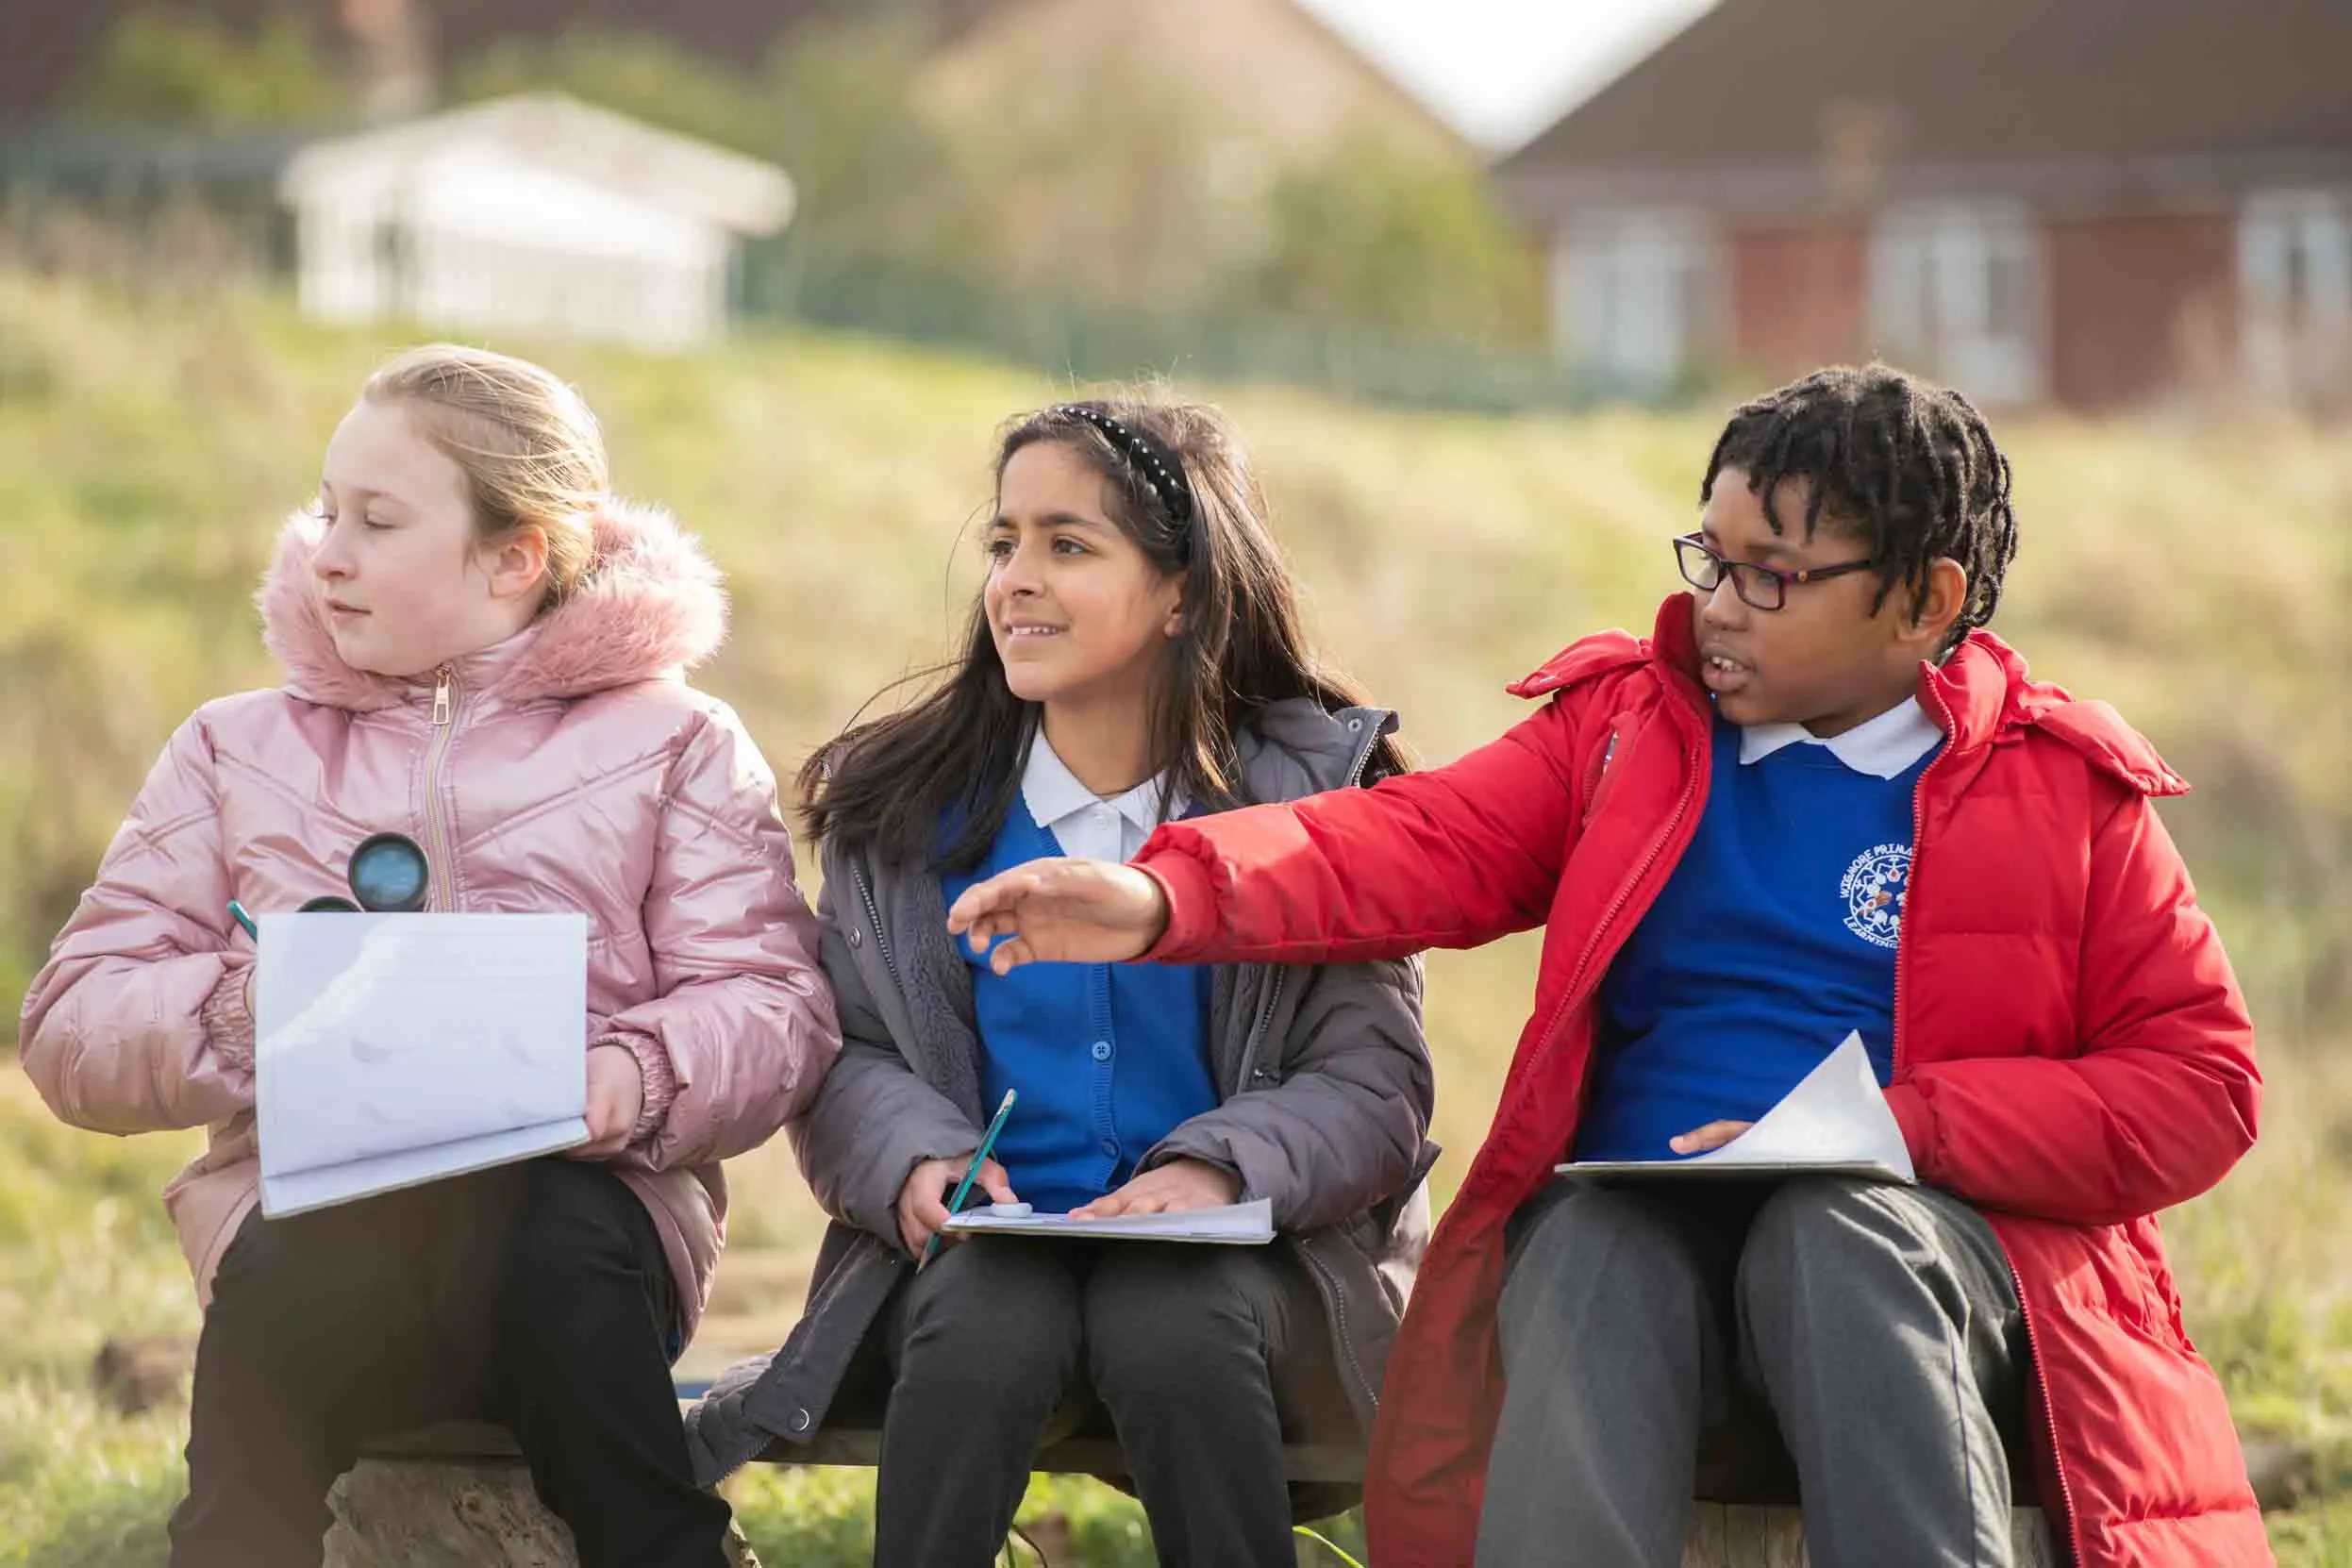
Big Schools’ Birdwatch provides an annual snapshot of how some of our best loved birds are faring on the school grounds. Take a look to see the top ten birds sighted in this year’s Big Schools Birdwatch. How does it compare with what you saw in your school grounds?
The survey would not have been possible without teachers and pupils becoming citizen scientists for the day. Thank you!
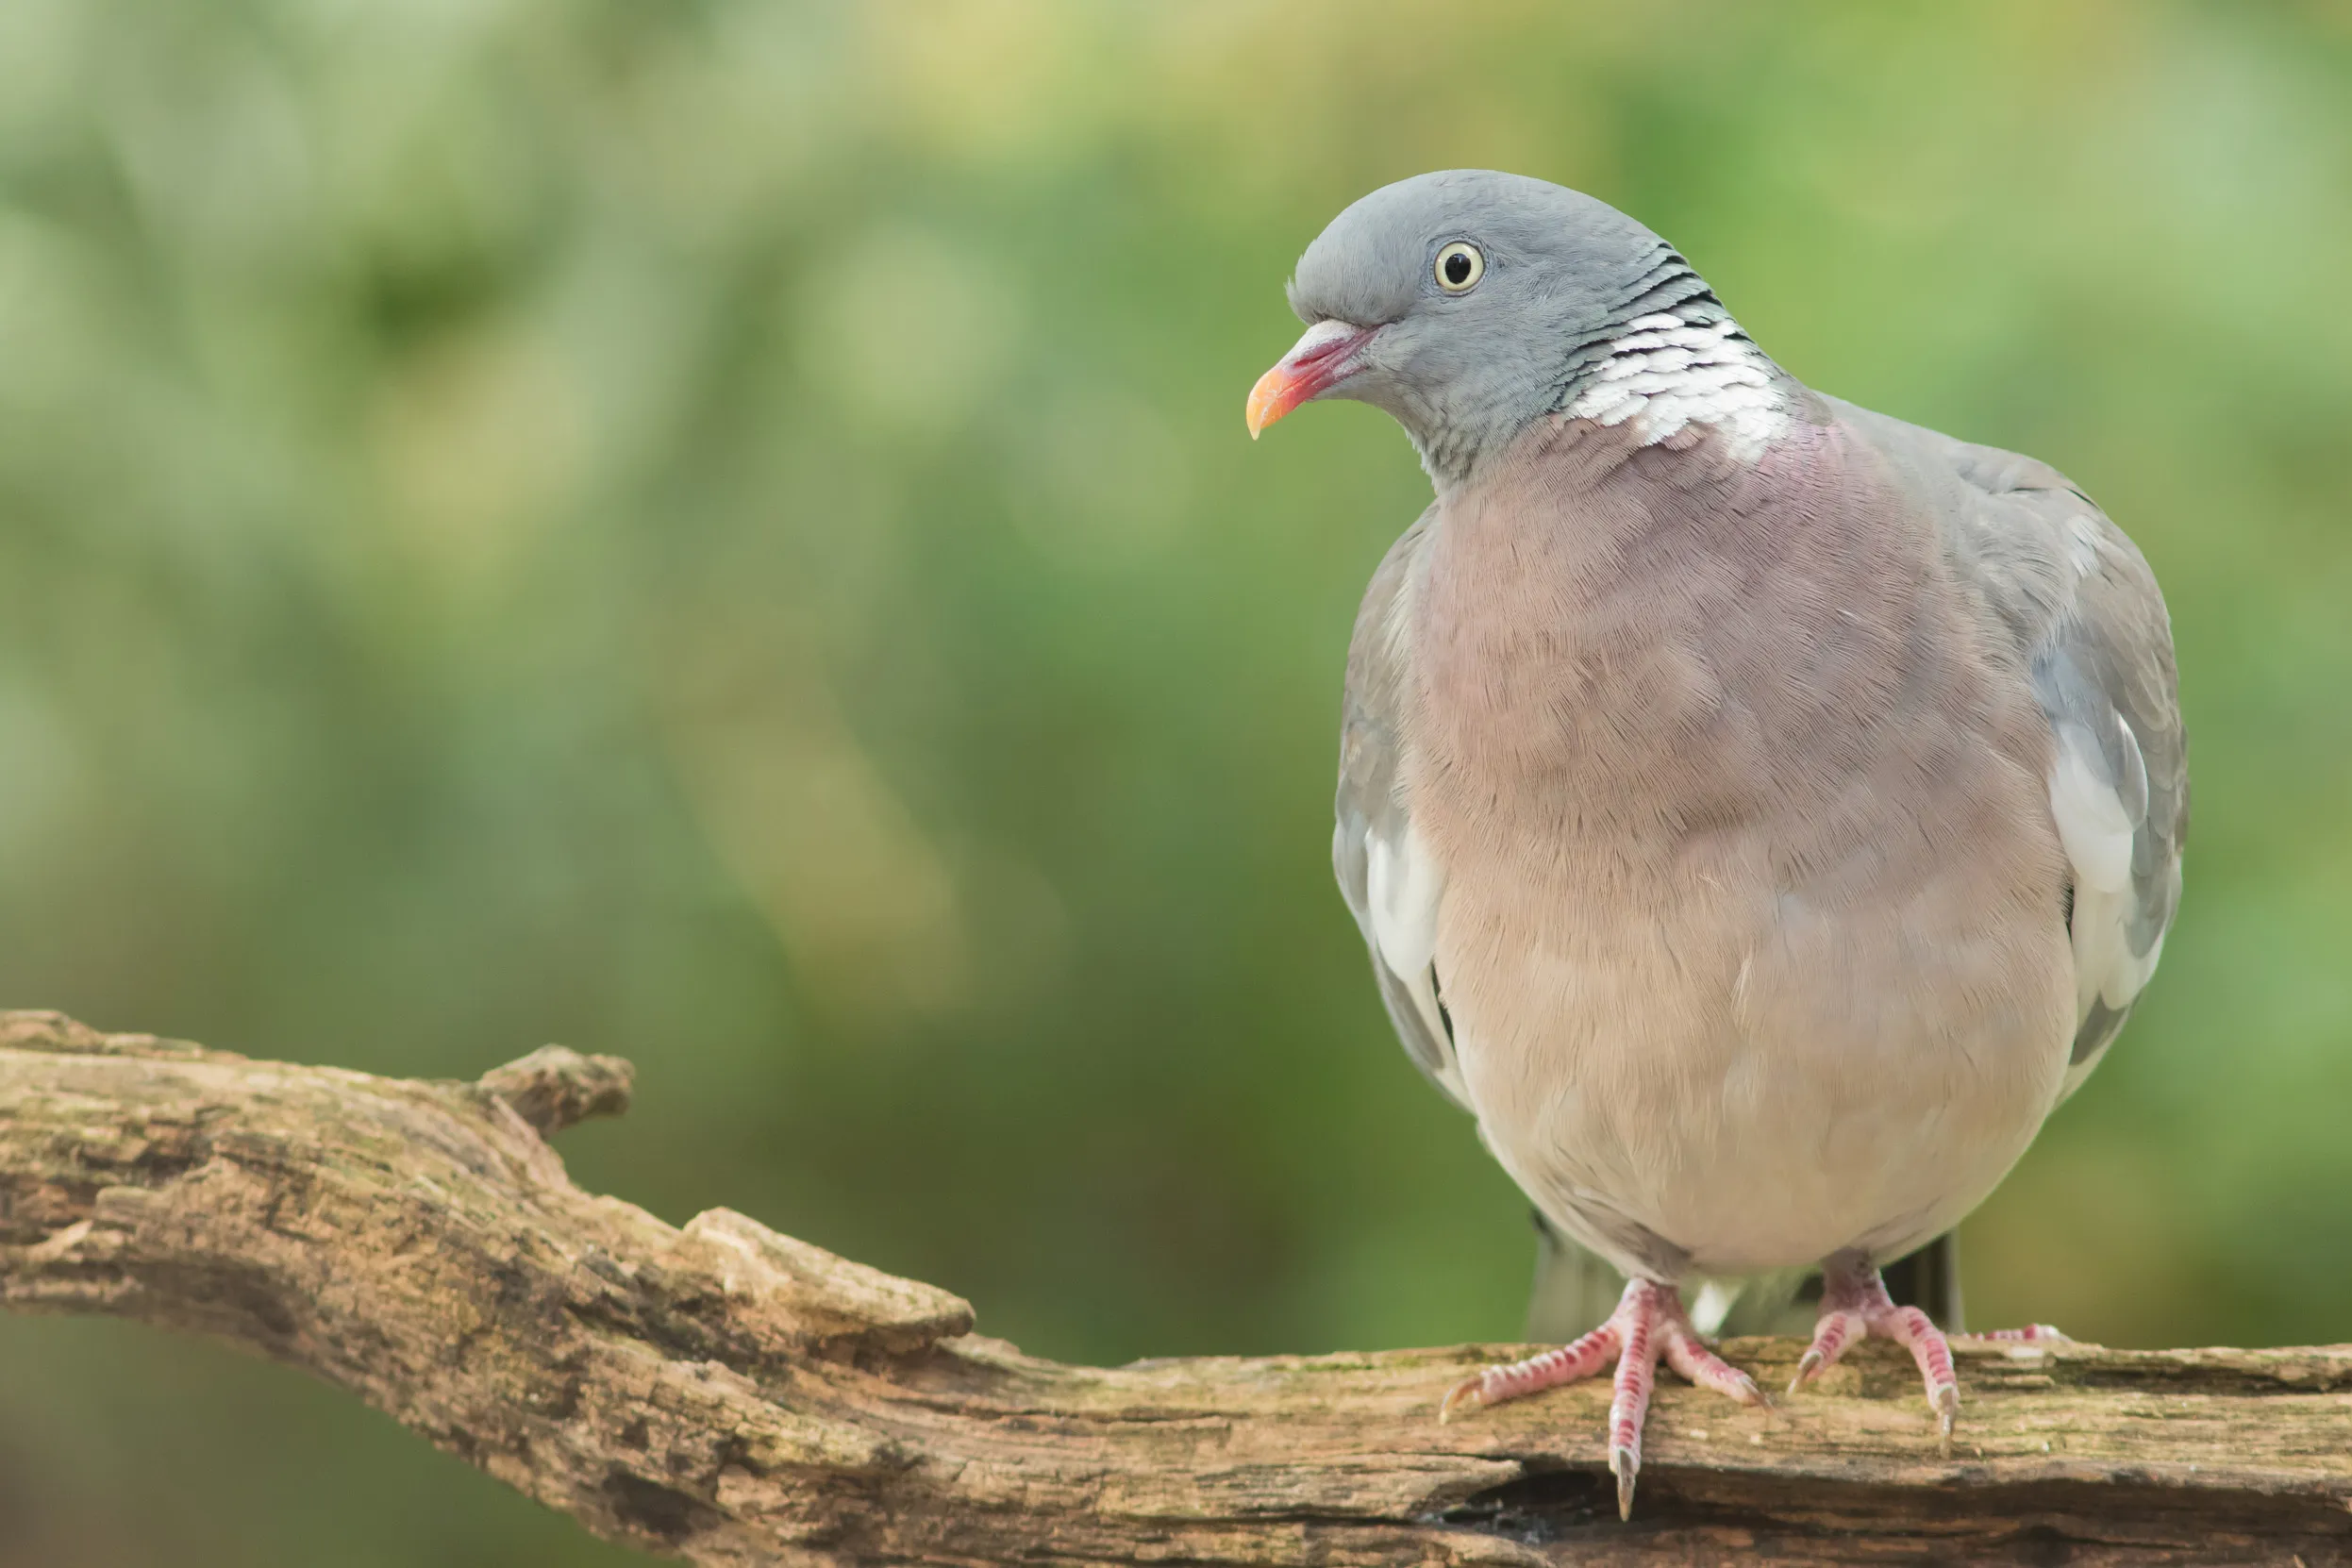
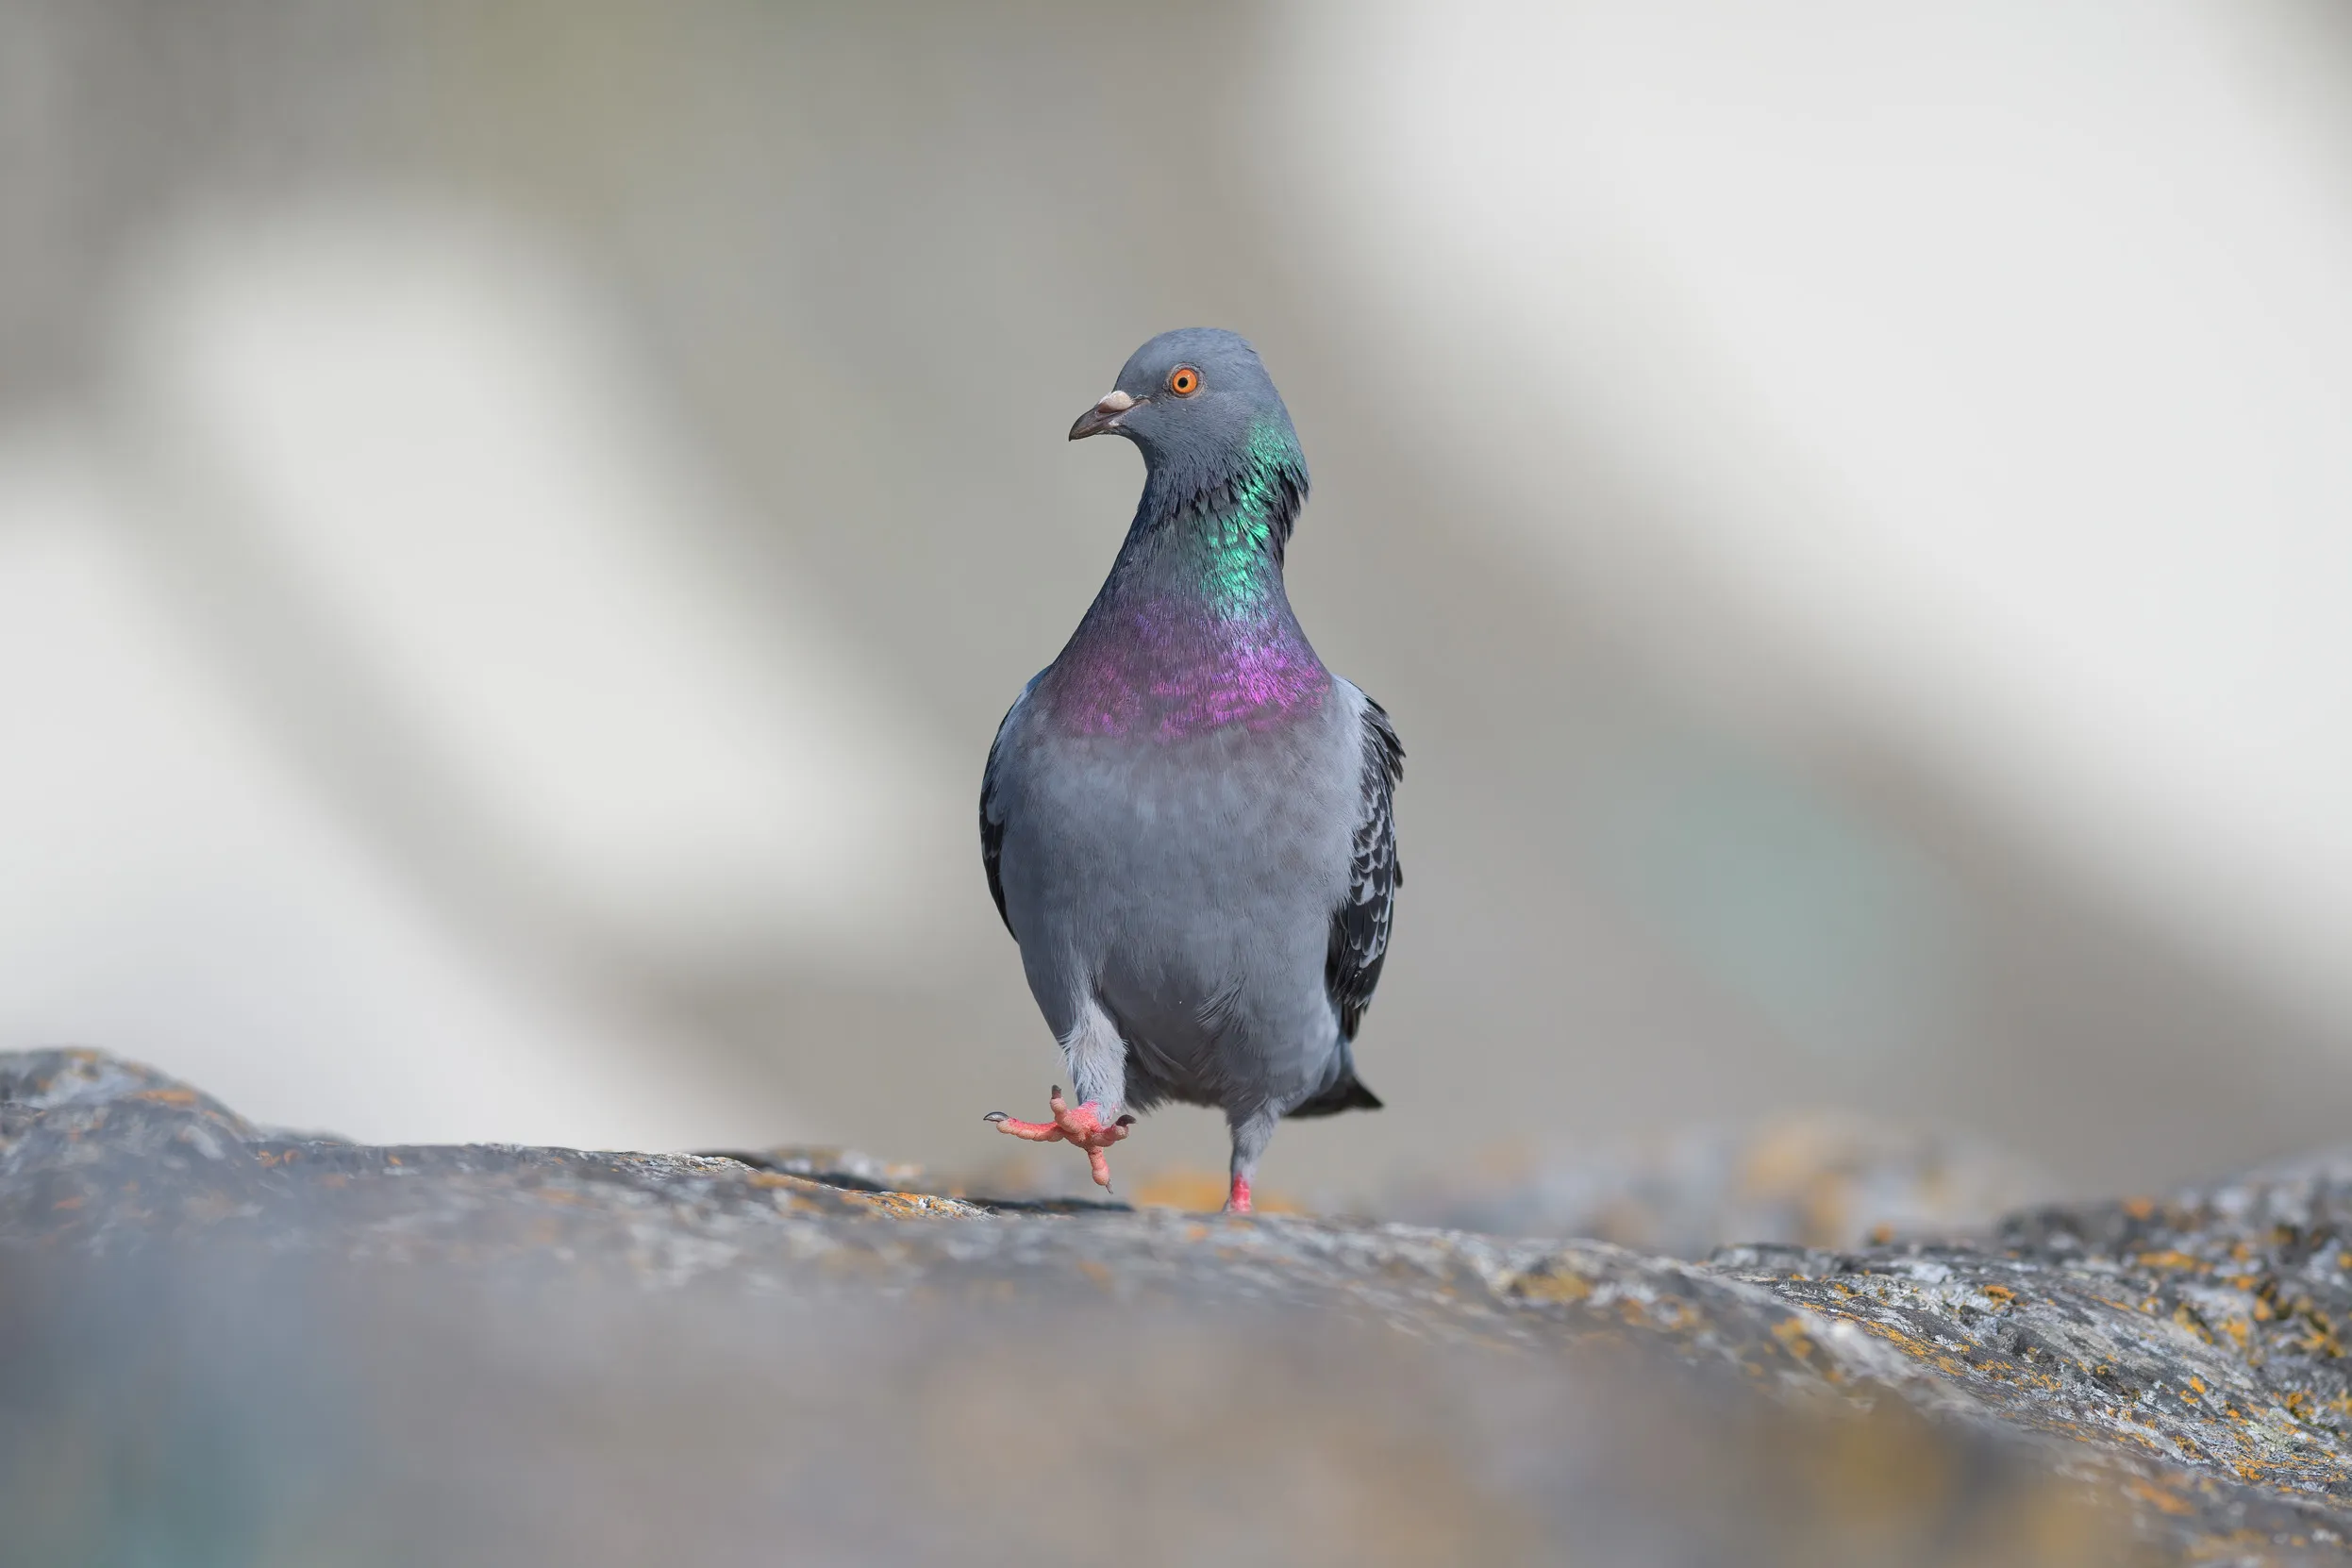
This year’s number one bird is the Woodpigeon. Woodpigeons are the UK’s largest and most common pigeon. They are found in the countryside, as well as towns and cities. Listen out for their repetitive cooing, which some people remember with the phrase, “My toe hurts, Betty”!
If you enjoyed Big Schools Birdwatch, then take a look at the RSPB’s Wild Challenge. This is a free award scheme for schools to help engage children with nature through practical learning opportunities. By doing Big Schools' Birdwatch, you're already one step closer to achieving a Bronze Award. You’ll find lots more activities, as well as ideas for creating more space for wildlife in your school grounds.